Introduction
In a previous article, with the same title, I demonstrated that the Greenplate effect does not occur.
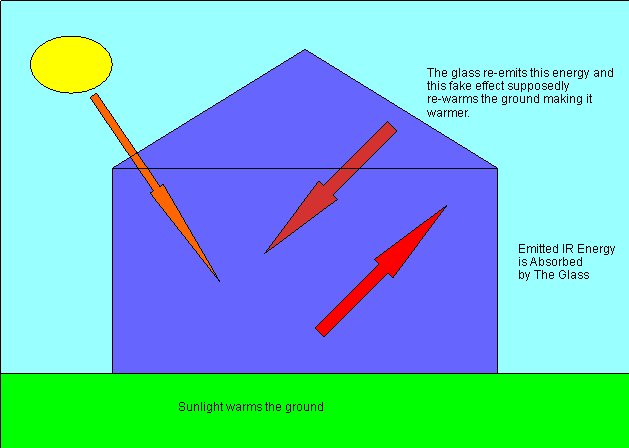
This is the supposed back radiation effect, which purportedly happens to a flat plate, if you expose it to a radiant heat source, within a vacuum and then simply put another plate behind it. The presence of the 2nd plate is supposed to cause an increase in the maximum steady state temperatures of the 1st plate as well as decrease the rate of heat loss, thus causing the 1st plate to warm more rapidly. This is a falsehood. Greenplate effect does not exist.
In my first demonstration, people criticised that the 1st plate was supported by brackets near the light and so this, apparently caused the test to fail. That is false argument, as I will demonstrate. It was also criticised for having the 2nd plate supported by the 1st with plastic spacers, because apparently this caused the test to fail also. Again, this is a false argument, as I will also show.
Although, it is reassuring that if we pretended that this back radiant effect existed, it is surely so weak, its is nullified by a handful of plastic spacers, in which case, it really is a feeble force and can be ignored entirely. Although, as you will see, Radiation Greenplate Effect is a force which does not exist.
New Experimental Arrangements
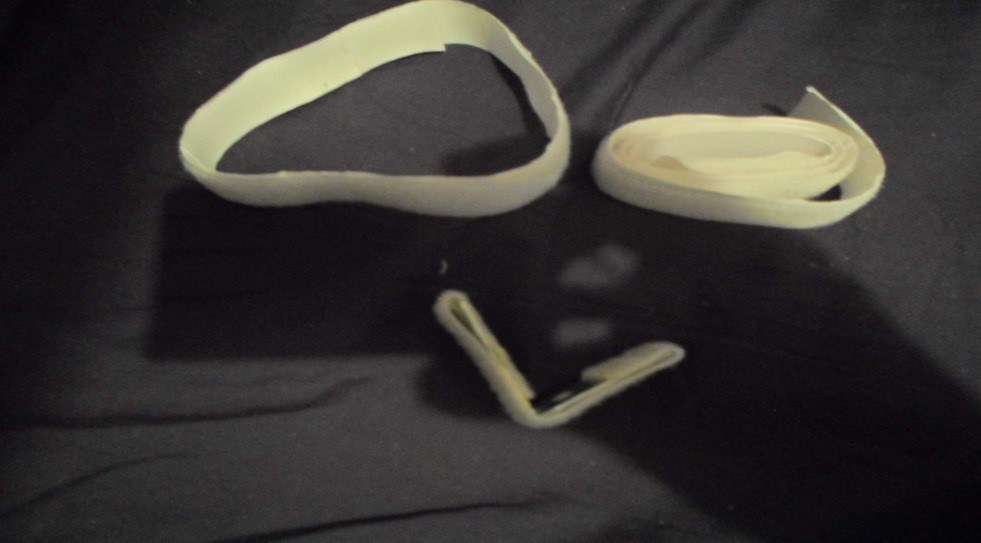
For my new arrangements I have plastic velceo straps on the inside of the cylinder. These velcro straps are glued to the glass on one side and glued to small right angle aluminium brackets on the other. The 130mm black powder coated aluminum disc, simply rests upon these supports.
Picture 1 – Velcro and Angle Bracket
Picture 2 – Brackets attached to inside of Cylinder
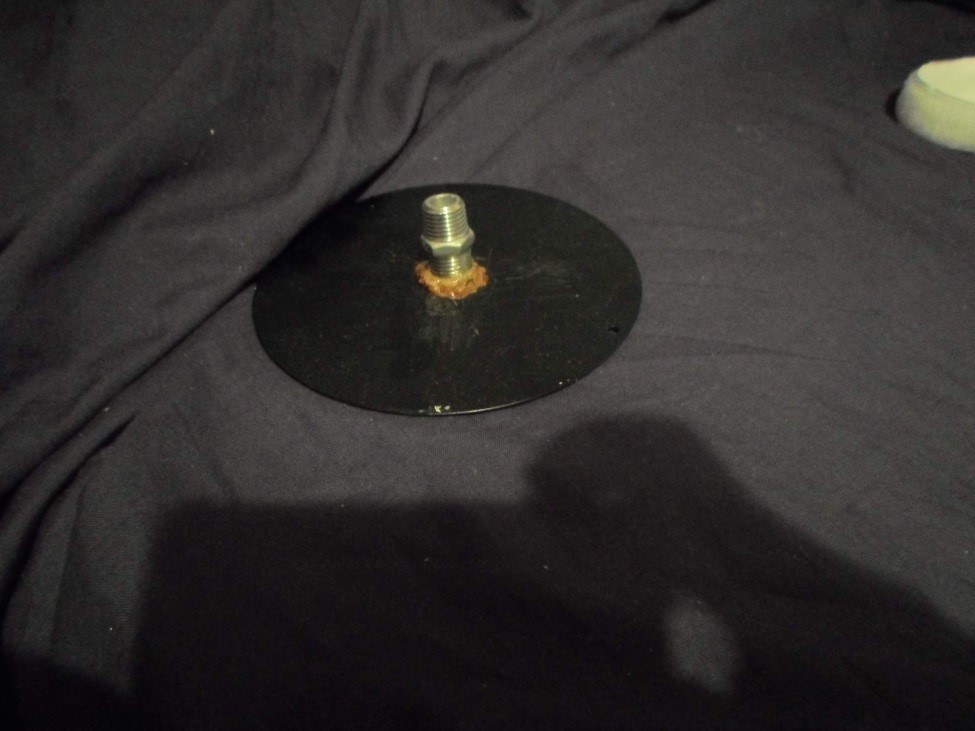
I have also added a support nipple to the bottom plate, so that the thermometer can go straight up the middle of the hole in the second plate. It is glued to the plate. This is done because the putty melts and burns and the thermometer slides.
Picture 3 – Bottom Plate
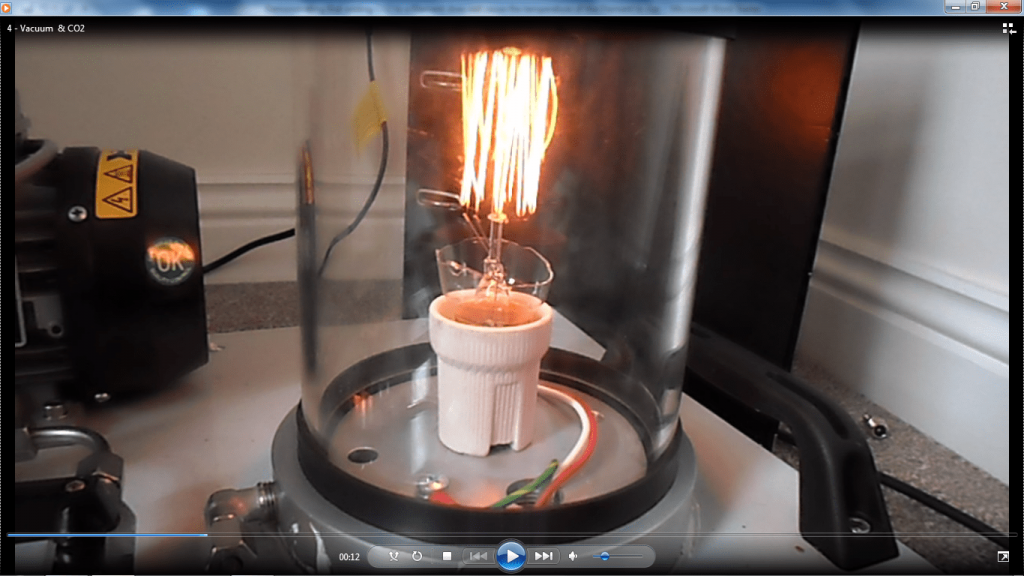
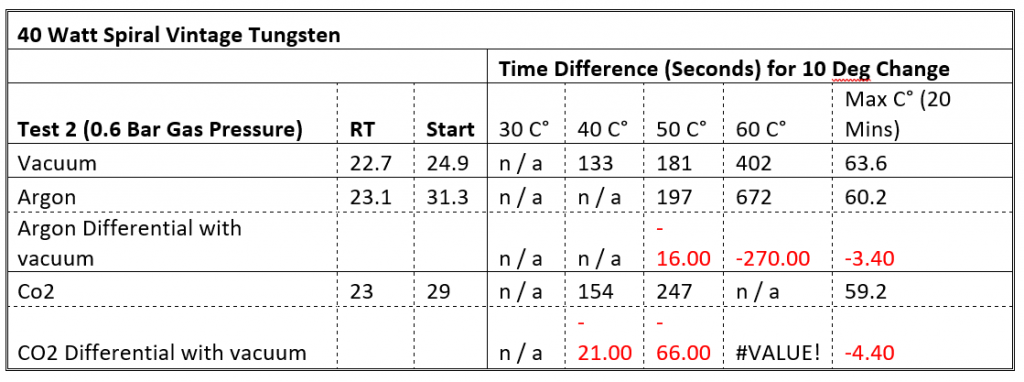
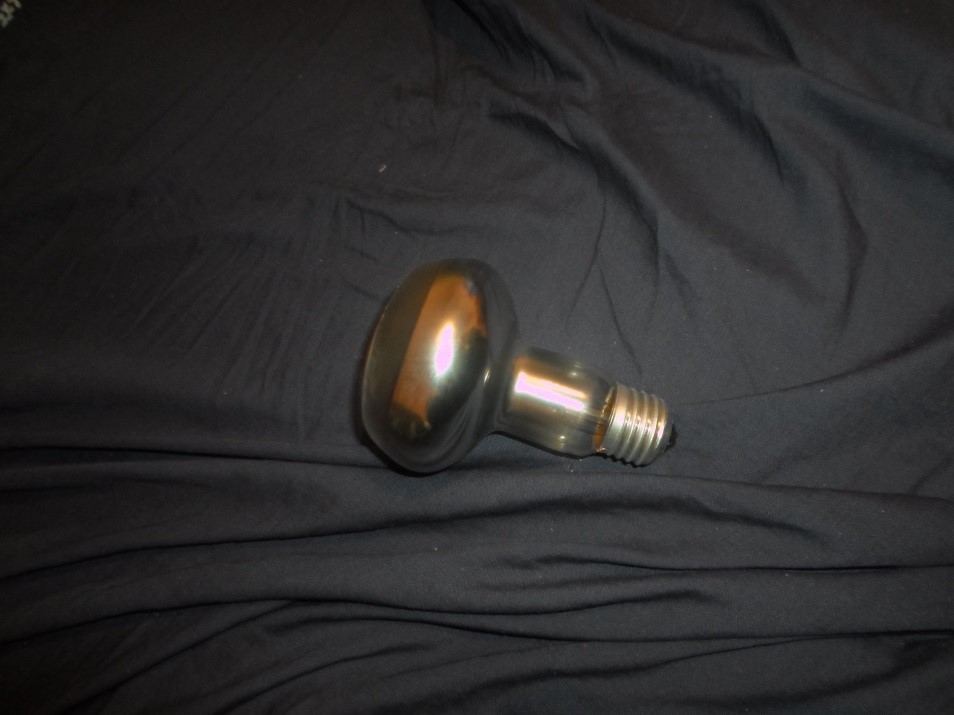
I have also changed the light bulb, from a 40 watt spiral bulb, to a 100 watt Bulb with built in reflector, this ensures that all the energy is directed upwards towards the plate & as it has a higher rating it is achieves higher steady state temperatures and achieves much quicker warming phases. I tested this bulb and fully exposed to atmosphere at room temperature, the maximum temperature of the glass achieved 206 degrees Celcius.
Picture 4 – New Bulb 100 Incandescent Halogen Reflector
These changes are more than sufficient to show that Radiation Greenplate Effect does not exist, & anyone who talks of it as if it is real is a liar, a charlatan or a faker. My demonstration model can be performed anywhere. Radiation GHE is a lie. Let no-one impart this lie upon you without you repelling it.
I have put together six different arrangements and tested each one, 5 times, with each test being performed one after the other for a duration of 10 minutes. The you-tube video which I have which shows Test 1 of each arrangement can be seen here. I video recorded all tests.
In the first minute of each video, I show the arrangement and then at exactly 1 minute of recording I switch on the light and record for 10 straight minutes. The unit is switched off and left to cool for 50 minutes.
The position of the bottom black plate and the cylinder itself remains unchanged through out all the tests. Each arrangement was tested on consecutive days, so Test 1 is a cold start each time.
Arrangement 1 – Single Plate in Chamber, No Lid.
In this arrangement I placed only a single black plate in the chamber, just above the light. The chamber lid was left off so that the plate is exposed to the air. I then switched it on and recorded the temperature of the plate over 10 minutes and repeated this 5 times, with each one performed after the other after a 50 minute cool-down each time.
The chamber as the lift is left off, would naturally result in the coolest temperatures as the maximum amount of convective cooling is experienced to the plate.
| Arrangement 1: One Plate Open Lid | |||||
| Time (Mins) | Test 1 | Test 2 | Test 3 | Test 4 | Test 5 |
| 0.0 | 23.3 | 25.7 | 25.7 | 26.9 | 26.3 |
| 0.5 | 26.8 | 29.9 | 30.0 | 31.7 | 30.5 |
| 1.0 | 33.1 | 37.1 | 37.6 | 39.1 | 38.1 |
| 1.5 | 40.2 | 43.5 | 44.3 | 45.9 | 45.5 |
| 2.0 | 46.7 | 49.9 | 51.3 | 52.6 | 52.8 |
| 2.5 | 53.3 | 56.5 | 57.7 | 59.3 | 60.0 |
| 3.0 | 59.5 | 62.1 | 64.1 | 65.5 | 66.4 |
| 3.5 | 65.2 | 67.5 | 69.9 | 70.9 | 72.7 |
| 4.0 | 70.5 | 72.3 | 75.1 | 76.0 | 78.3 |
| 4.5 | 74.9 | 77.0 | 80.1 | 80.9 | 83.5 |
| 5.0 | 79.5 | 81.1 | 84.6 | 85.2 | 88.2 |
| 5.5 | 83.6 | 85.6 | 88.7 | 89.3 | 92.5 |
| 6.0 | 87.3 | 89.5 | 92.5 | 93.1 | 96.5 |
| 6.5 | 91.0 | 92.9 | 96.2 | 96.4 | 100.4 |
| 7.0 | 94.2 | 95.9 | 99.5 | 99.5 | 103.9 |
| 7.5 | 97.5 | 98.8 | 102.7 | 102.5 | 107.1 |
| 8.0 | 100.5 | 101.5 | 105.7 | 105.4 | 110.4 |
| 8.5 | 103.3 | 104.1 | 108.1 | 107.7 | 113.9 |
| 9.0 | 105.6 | 106.3 | 110.7 | 110.0 | 116.4 |
| 9.5 | 107.7 | 108.5 | 113.0 | 112.3 | 118.5 |
| 10.0 | 110.0 | 110.4 | 115.0 | 114.3 | 120.5 |
| Change | 86.7 | 84.7 | 89.3 | 87.4 | 94.2 |
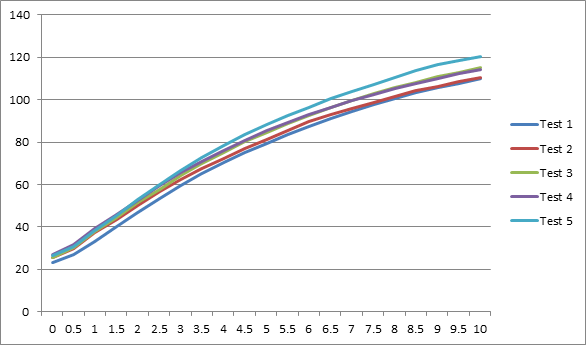
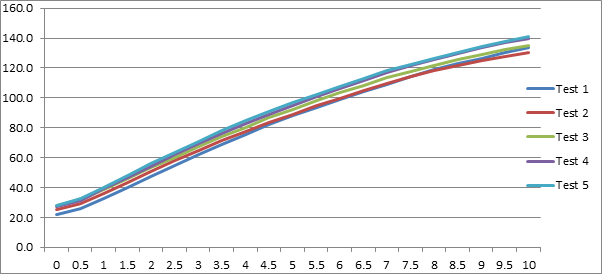
Here we can see that, each test is warmer than the last as some residual heat has remained during the 50 minute cooldown period. Although test 2 after 10 minutes had the same peak temperature as test 1, despite starting slightly higher. Peak temperature between 110 & 120.5 degrees Celsius were experienced.
Graph 1 – Arrangement 1
Arrangement 2: Single Plate in Chamber, Lid Placed & Valves Closed.
In this arrangement there is a single plate as previously, this time I have placed the plastic chamber lid in position and ensured that the valves are closed to prevent any air ingress/egress.
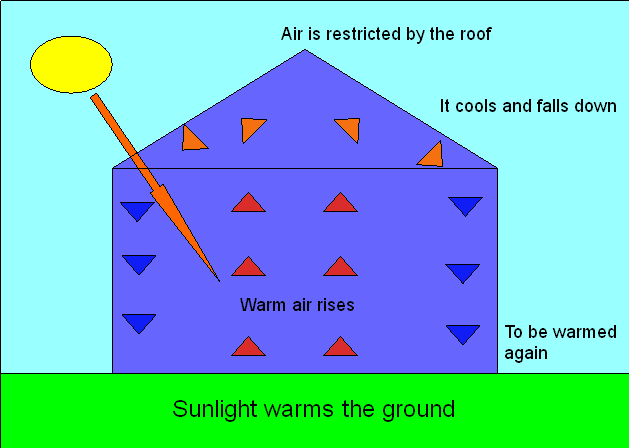
It would be expected that restricting the convective cooling, by adding the lid, will result in quicker warming and higher peak temperatures, which is exactly what occurred. This is how a greenhouse works.
| Arrangement 2: One Plate Closed Lid | |||||
| Time (Mins) | Test 1 | Test 2 | Test 3 | Test 4 | Test 5 |
| 0.0 | 23.1 | 25.6 | 24.3 | 27.3 | 24.4 |
| 0.5 | 24.7 | 30.5 | 29.0 | 32.5 | 29.5 |
| 1.0 | 28.6 | 38.6 | 36.9 | 41.2 | 38.3 |
| 1.5 | 33.3 | 46.0 | 44.7 | 49.4 | 46.5 |
| 2.0 | 38.8 | 53.7 | 52.1 | 57.3 | 54.2 |
| 2.5 | 44.6 | 60.6 | 59.3 | 64.9 | 62.0 |
| 3.0 | 50.6 | 67.4 | 66.1 | 71.5 | 68.8 |
| 3.5 | 57.4 | 73.7 | 72.3 | 78.2 | 75.0 |
| 4.0 | 63.7 | 79.3 | 78.1 | 83.9 | 80.8 |
| 4.5 | 77.1 | 84.4 | 83.6 | 89.5 | 86.4 |
| 5.0 | 84.4 | 89.2 | 88.4 | 94.7 | 91.5 |
| 5.5 | 90.1 | 94.0 | 93.4 | 99.5 | 96.2 |
| 6.0 | 94.8 | 97.9 | 97.5 | 103.8 | 100.6 |
| 6.5 | 99.3 | 101.7 | 101.9 | 107.6 | 104.3 |
| 7.0 | 103.5 | 105.1 | 105.8 | 111.5 | 107.9 |
| 7.5 | 107.2 | 108.1 | 109.2 | 115.0 | 111.4 |
| 8.0 | 111.1 | 111.4 | 112.8 | 118.0 | 114.5 |
| 8.5 | 114.2 | 114.4 | 115.9 | 121.0 | 117.4 |
| 9.0 | 117.1 | 117.2 | 118.7 | 123.5 | 120.0 |
| 9.5 | 119.8 | 120.0 | 121.3 | 125.8 | 122.4 |
| 10.0 | 122.2 | 122.4 | 123.6 | 127.7 | 124.5 |
| Change | 99.1 | 96.8 | 99.3 | 100.4 | 100.1 |
We can see that peak temperatures are higher here and that temperatures increased more quickly than previously. Peak temperatures of between 122.2 & 127.7 were recorded.
As you will see, the lid of the roof offered no back radiant heat induction upon the plate. The temperature increase is entirely explained by a reduction in the rate of convective cooling.
Graph 2 – Arrangement 2
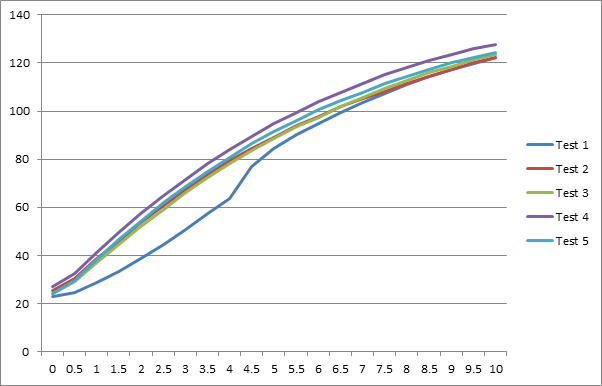
No idea why Test 1 had that sort of curve; nothing changed with the test. I just put it down to the thermometer lag on the read out.
Arrangement 3 – Two Plates – Open Lid
Here, this arrangement is the same as Arrangement 1, except now there are two plates instead of one.
The convective restriction is much more stark than the merely placing the lid. As the 2nd plate is the same 130mm diameter as the first plate and there is a mere 2.5mm space around this disc to the glass, offering minimal escape path for the air. Meaning the space for convective cooling of the bottom plate is only that between the 1st and 2nd which is a mere 40mm. The nipple on the bottom plate is 20mm long. This ensures no contact between the two plates. This restriction causes a large increase in peak temperatures and an increase in the rate of warming also.
| Arrangement 3: Two Plate Open Lid | |||||
| Time (Mins) | Test 1 | Test 2 | Test 3 | Test 4 | Test 5 |
| 0.0 | 24.4 | 25.8 | 24.3 | 26.3 | 26.7 |
| 0.5 | 27.5 | 29.9 | 28.2 | 31.0 | 31.1 |
| 1.0 | 34.5 | 37.6 | 36.3 | 39.1 | 39.1 |
| 1.5 | 42.6 | 45.4 | 44.5 | 47.3 | 47.1 |
| 2.0 | 51.6 | 53.5 | 53.1 | 55.4 | 55.3 |
| 2.5 | 59.7 | 61.2 | 61.2 | 63.6 | 63.4 |
| 3.0 | 67.3 | 68.6 | 68.7 | 71.0 | 71.0 |
| 3.5 | 74.8 | 75.8 | 76.2 | 78.1 | 78.4 |
| 4.0 | 81.8 | 82.2 | 83.1 | 84.8 | 85.2 |
| 4.5 | 88.3 | 88.7 | 89.6 | 91.4 | 91.9 |
| 5.0 | 94.5 | 94.8 | 95.8 | 97.4 | 97.9 |
| 5.5 | 100.7 | 100.6 | 101.7 | 102.9 | 103.8 |
| 6.0 | 105.9 | 106.1 | 107.5 | 108.2 | 109.1 |
| 6.5 | 111.6 | 111.3 | 113.0 | 113.4 | 114.3 |
| 7.0 | 116.5 | 116.3 | 117.9 | 117.9 | 119.4 |
| 7.5 | 120.6 | 120.9 | 122.4 | 122.0 | 123.6 |
| 8.0 | 124.8 | 125.2 | 126.4 | 125.8 | 127.7 |
| 8.5 | 128.5 | 129.3 | 130.8 | 129.5 | 131.7 |
| 9.0 | 132.3 | 133.0 | 134.6 | 133.1 | 135.4 |
| 9.5 | 135.6 | 136.7 | 138.1 | 136.5 | 138.7 |
| 10.0 | 139.0 | 139.8 | 141.3 | 139.5 | 141.9 |
| Change | 114.6 | 114.0 | 117.0 | 113.2 | 115.2 |
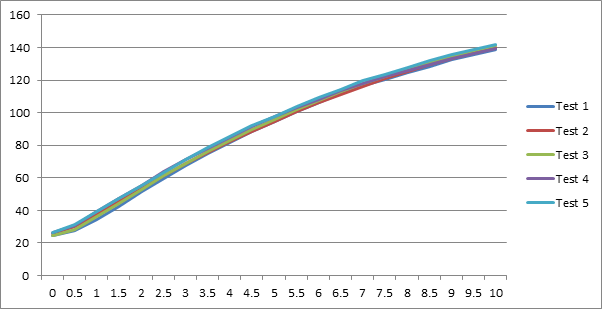
We can see that peak temperature after 10 minutes is between 139 and 141.9 degrees Celsius.
Graph 3 – Arrangement 3
Arrangement 4 – Two Plates – Closed Lid
This is the same as arrangement 3, except as in arrangement 2 I have now placed the lid on the chamber. This made no difference to the bottom plate, as the convective restriction between plate 1 and 2 has not changed. Only the rate of cooling of the 2nd plate would be affected.
| Arrangement 4: Two Plate Closed Lid | |||||
| Time (Mins) | Test 1 | Test 2 | Test 3 | Test 4 | Test 5 |
| 0.0 | 21.9 | 25.5 | 27.9 | 27.3 | 28.2 |
| 0.5 | 25.9 | 29.2 | 31.9 | 31.5 | 32.7 |
| 1.0 | 32.3 | 35.9 | 38.9 | 39.0 | 40.3 |
| 1.5 | 39.8 | 43.3 | 45.9 | 46.8 | 47.9 |
| 2.0 | 47.4 | 50.7 | 53.3 | 54.3 | 55.9 |
| 2.5 | 54.8 | 58.1 | 60.3 | 62.0 | 63.4 |
| 3.0 | 62.1 | 64.8 | 67.4 | 69.1 | 70.8 |
| 3.5 | 69.0 | 71.5 | 74.0 | 75.9 | 77.8 |
| 4.0 | 75.6 | 77.4 | 80.4 | 82.8 | 84.6 |
| 4.5 | 82.0 | 83.5 | 86.9 | 89.0 | 90.8 |
| 5.0 | 87.9 | 89.1 | 92.4 | 94.9 | 96.8 |
| 5.5 | 93.7 | 94.7 | 98.1 | 100.9 | 102.4 |
| 6.0 | 98.8 | 99.8 | 103.5 | 106.5 | 107.9 |
| 6.5 | 104.1 | 104.7 | 108.2 | 111.9 | 113.2 |
| 7.0 | 109.1 | 109.7 | 113.3 | 117.1 | 118.2 |
| 7.5 | 114.2 | 114.3 | 117.6 | 121.5 | 122.6 |
| 8.0 | 119.0 | 118.3 | 121.8 | 125.7 | 126.6 |
| 8.5 | 123.0 | 121.8 | 125.3 | 129.9 | 130.5 |
| 9.0 | 126.5 | 124.8 | 128.9 | 133.5 | 134.3 |
| 9.5 | 130.2 | 127.9 | 132.3 | 137.2 | 137.8 |
| 10.0 | 133.5 | 130.6 | 135.2 | 140.0 | 141.1 |
| Change | 111.6 | 105.1 | 107.3 | 112.7 | 112.9 |
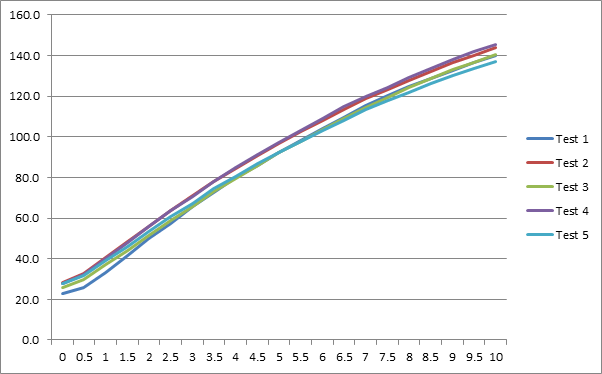
Peak temperatures between 130.5 & 141.1 were experienced, maximum attained was no higher than in arrangement 3.
Graph 4 – Arrangement 4
Arrangement 5 – Two Plates, Closed Lid & Full Vacuum
In this arrangement I had the two plates as in arrangements 3 & 4, but this time the lid was placed and all the air was sucked out to provide a full Vacuum.
| Arrangement 5: Two Plate Vacuum | |||||
| Time (Mins) | Test 1 | Test 2 | Test 3 | Test 4 | Test 5 |
| 0.0 | 23.0 | 28.5 | 25.7 | 27.9 | 27.6 |
| 0.5 | 26.0 | 32.8 | 29.8 | 32.4 | 31.6 |
| 1.0 | 33.1 | 40.7 | 36.9 | 40.3 | 39.0 |
| 1.5 | 41.5 | 48.3 | 44.0 | 48.1 | 46.2 |
| 2.0 | 49.9 | 55.7 | 51.6 | 55.7 | 53.6 |
| 2.5 | 57.5 | 63.8 | 59.0 | 63.6 | 60.6 |
| 3.0 | 65.7 | 71.0 | 65.9 | 70.7 | 67.4 |
| 3.5 | 72.6 | 77.9 | 73.1 | 77.9 | 74.3 |
| 4.0 | 79.8 | 84.4 | 79.5 | 84.7 | 80.5 |
| 4.5 | 86.1 | 90.8 | 86.1 | 91.1 | 86.7 |
| 5.0 | 92.3 | 96.8 | 92.1 | 97.2 | 92.4 |
| 5.5 | 98.2 | 102.7 | 97.8 | 103.2 | 97.9 |
| 6.0 | 104.0 | 107.8 | 103.7 | 109.1 | 103.3 |
| 6.5 | 109.7 | 113.3 | 109.1 | 114.7 | 108.1 |
| 7.0 | 115.2 | 118.6 | 114.3 | 119.9 | 113.4 |
| 7.5 | 120.3 | 123.1 | 119.4 | 124.4 | 117.7 |
| 8.0 | 124.6 | 127.6 | 124.2 | 129.3 | 122.0 |
| 8.5 | 128.8 | 132.0 | 128.5 | 133.6 | 126.0 |
| 9.0 | 132.8 | 136.3 | 132.9 | 137.9 | 130.0 |
| 9.5 | 136.5 | 140.1 | 136.7 | 141.9 | 133.5 |
| 10.0 | 140.0 | 143.9 | 140.3 | 145.5 | 137.2 |
| Change | 117.0 | 115.4 | 114.6 | 117.6 | 109.6 |
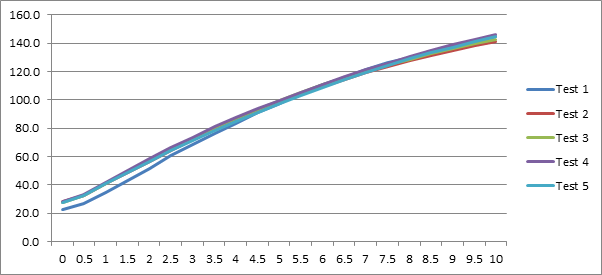
Temperatures in this arrangement are above that of 3 and 4, with temperatures in the region of 137.2 to 145.5 achieved. Warming rates were also much higher. With all tests being over 100 deg C in less than 6 minutes.
This is no surprise as there is no convective cooling occurring at all. The other arrangements were warmer because we reduced the rate of convective cooling. With no convective cooling only radiation cooling is available to the plates and a negligible conductive cooling to the glass via the velcro straps. (Borroscillate glass has a high thermal resistance).
Graph 5 – Arrangement 5
Arrangement 6 – Single Plate, Closed Lid & Full Vacuum
In this final arrangement, the top plate was removed and test performed in full vacuum.
| Arrangement 6: One Plate Vacuum | |||||
| Time (Mins) | Test 1 | Test 2 | Test 3 | Test 4 | Test 5 |
| 0.0 | 22.7 | 28.5 | 27.6 | 28.2 | 27.7 |
| 0.5 | 27.1 | 32.6 | 32.7 | 33.1 | 32.7 |
| 1.0 | 34.8 | 40.7 | 41.2 | 41.9 | 40.7 |
| 1.5 | 43.2 | 48.6 | 49.4 | 50.1 | 48.7 |
| 2.0 | 51.9 | 56.6 | 57.5 | 58.4 | 56.5 |
| 2.5 | 60.4 | 64.6 | 65.4 | 66.4 | 64.1 |
| 3.0 | 68.4 | 71.8 | 72.7 | 73.7 | 71.1 |
| 3.5 | 76.2 | 79.1 | 80.2 | 80.9 | 78.1 |
| 4.0 | 83.6 | 85.8 | 86.7 | 87.2 | 84.5 |
| 4.5 | 91.0 | 92.2 | 93.5 | 93.6 | 91.0 |
| 5.0 | 97.6 | 98.2 | 99.5 | 99.5 | 97.1 |
| 5.5 | 104.4 | 104.0 | 105.3 | 105.4 | 103.1 |
| 6.0 | 110.5 | 109.4 | 110.7 | 111.1 | 108.6 |
| 6.5 | 116.1 | 114.6 | 115.9 | 116.5 | 114.2 |
| 7.0 | 121.6 | 119.5 | 120.7 | 121.5 | 119.6 |
| 7.5 | 126.0 | 123.6 | 124.7 | 125.8 | 124.3 |
| 8.0 | 130.2 | 127.5 | 128.7 | 130.4 | 128.9 |
| 8.5 | 134.0 | 131.5 | 132.6 | 134.7 | 133.2 |
| 9.0 | 137.9 | 134.8 | 136.1 | 138.7 | 137.1 |
| 9.5 | 141.4 | 138.1 | 139.5 | 142.7 | 141.1 |
| 10.0 | 144.6 | 141.2 | 142.7 | 145.9 | 144.6 |
| Change | 121.9 | 112.7 | 115.1 | 117.7 | 116.9 |
Arrangement 6 – Single Plate, Closed Lid & Full Vacuum
In this final arrangement, the top plate was removed and test performed in full vacuum.
We can see that peak temperatures of 141.2 to 145.9 were experienced. The rates of heating are virtually identical to arrangement 5, with the exception being test 5 on arrangement 5, which I have chosen to ignore on my statistical analysis. Nothing was changed. The cylinders are air tight and hold with no change in Vacuum pressure over 24 hours. I presumed the light output fluctuated on the low side.
The presence of the 2nd plate has no effect on the peak temperature or rate of heating experienced after 10 minutes. This is more obvious when comparing the averaged data on graphs below.
Mean Analysis
| Average | A1 | A2 | A3 | A4 (Exc O) | A5 | A5(Exc O) | A6 |
| 0.0 | 25.6 | 24.9 | 25.5 | 26.3 | 26.5 | 26.3 | 26.9 |
| 0.5 | 29.8 | 29.2 | 29.5 | 30.5 | 30.5 | 30.3 | 31.6 |
| 1.0 | 37.0 | 36.7 | 37.3 | 37.6 | 38.0 | 37.8 | 39.9 |
| 1.5 | 43.9 | 44.0 | 45.4 | 45.1 | 45.6 | 45.5 | 48.0 |
| 2.0 | 50.7 | 51.2 | 53.8 | 52.7 | 53.3 | 53.2 | 56.2 |
| 2.5 | 57.4 | 58.3 | 61.8 | 60.1 | 60.9 | 61.0 | 64.2 |
| 3.0 | 63.5 | 64.9 | 69.3 | 67.4 | 68.1 | 68.3 | 71.5 |
| 3.5 | 69.2 | 71.3 | 76.7 | 74.2 | 75.2 | 75.4 | 78.9 |
| 4.0 | 74.4 | 77.2 | 83.4 | 80.9 | 81.8 | 82.1 | 85.6 |
| 4.5 | 79.3 | 84.2 | 90.0 | 87.2 | 88.2 | 88.5 | 92.3 |
| 5.0 | 83.7 | 89.6 | 96.1 | 93.0 | 94.2 | 94.6 | 98.4 |
| 5.5 | 87.9 | 94.6 | 101.9 | 98.8 | 100.0 | 100.5 | 104.4 |
| 6.0 | 91.8 | 98.9 | 107.4 | 104.2 | 105.6 | 106.2 | 110.1 |
| 6.5 | 95.4 | 103.0 | 112.7 | 109.4 | 111.0 | 111.7 | 115.5 |
| 7.0 | 98.6 | 106.8 | 117.6 | 114.4 | 116.3 | 117.0 | 120.6 |
| 7.5 | 101.7 | 110.2 | 121.9 | 119.0 | 121.0 | 121.8 | 124.9 |
| 8.0 | 104.7 | 113.6 | 126.0 | 123.3 | 125.5 | 126.4 | 129.1 |
| 8.5 | 107.4 | 116.6 | 130.0 | 127.2 | 129.8 | 130.7 | 133.2 |
| 9.0 | 109.8 | 119.3 | 133.7 | 130.8 | 134.0 | 135.0 | 136.9 |
| 9.5 | 112.0 | 121.9 | 137.1 | 134.4 | 137.7 | 138.8 | 140.6 |
| 10.0 | 114.0 | 124.1 | 140.3 | 137.5 | 141.4 | 142.4 | 143.8 |
| 88.5 | 99.1 | 114.8 | 111.1 | 114.8 | 116.2 | 116.9 |
Arrangements 4 & 5 had a test with abnormally low peak temperatures, I elected to ignore these. Here we can see that Arrangement 5 mean temperatures are virtually identical to Arrangement 6 mean temperatures across the 5 tests. Wheras the increasing temperatures and faster warming patterns are obvious between the arrangements where convective cooling restrictions were applied and then convection was removed altogether.
This is also as represented in the graph below.
Graph 7 – Mean Averaged Temperature Curves
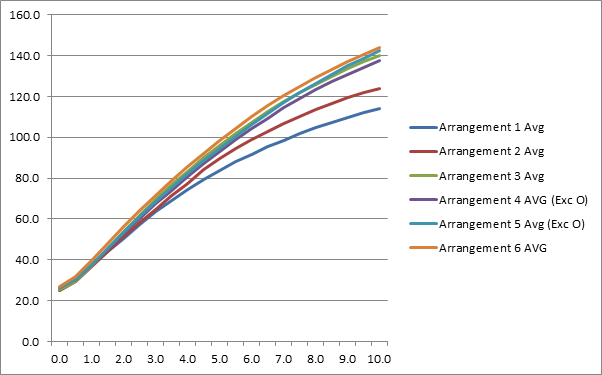
We can see in Graph 7, that the Vacuum arrangements are the hottest and warm the fastest, with virtually indistinguishable lines between arrangement 5 & 6.
Conclusion
The 1st arrangement was coolest and warmed least slowly, because the lower plate had the highest level of convective cooling exposed to it. The 2nd arrangement, the application of the lid, raised temperatures roughly by 5 to 10 degrees as the convective cooling was restricted to that inside the chamber only. This is how a greenhouse works. The addition of the lid, gave no radiant heating boost to the bottom plate.
Arrangements 3 and 4 gave roughly similar results to the temperatures of the bottom plates, because convection was restricted to the volume of air trapped in the 40mm space between the plates.
Arrangements 5 & 6 had no air in them at all, thus experienced no convective cooling and only cooled by radiation. This is why they exhibited virtually identical patterns of warming. No reduction in the rate of cooling, as a result of a supposed heat gain from the presence of the 2nd plate occurred. If the back radiant effect was real, the temperature of the 1st plate would have been much higher indeed and warmed far quicker, but it did not.
This is because Radiation Greenhouse Effect as a force does not exist. The mathematical explanation given in the Greenplate effect is wrong, it is false. To use it, is to mislead people. Any theories and fake physics based upon it all wrong, they are quite simply falsehoods. The 2nd Law of Thermodynamics forbids this back radiant heating, back radiant heating which did not & does not occur as everyone can quite plainly see.
Geraint Hughes is the author of Black Dragon: Breaking the Frizzle Frazzle of the Big Lie of Climate Change Science.
The image shows, “Midsummer Eve Bonfire,” by Nikolai Astrup, ca. 1904-1917.